Chart of the week

Equity volatility bounced in February, yet remains below average

VIX averaged a historic low in 2017 and remains relatively constrained

March 2, 2018 | 1 minute read
  • The S&P 500 Index generated its first negative total return in February since October 2016 as the equity and credit markets saw volatility bounce again.1 Returns on investment grade and high yield corporate bonds were also negative for the month, with high yield bonds experiencing their worst monthly performance since January 2016.2,3
  • Following strong performances in January, markets largely pulled back as investors weighed the potential for a quicker pace of interest rate hikes by the FOMC amid signs of improved U.S. economic growth and renewed inflationary pressure.
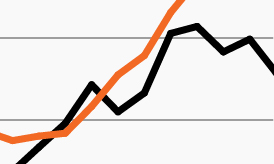
  • In mid-February, the CBOE Volatility Index (VIX), which measures investor expectations of near-term volatility, reached 37, its highest point since September 2011.4 The index later declined from its mid-month peak, but generally remained elevated, averaging approximately 22 for the entire month of February.4
  • Despite the recent uptick in market volatility, 2018 has perhaps presented a more typical market environment than last year. For example, 2017 generally provided investors with strong market returns amid historically low levels of volatility.
  • As the chart highlights, volatility can spike quickly and without notice. Given recent conditions, it may be wise for investors to proactively prepare for further volatility before it arrives.

  • Federal Reserve Bank of St. Louis, S&P 500, http://bit.ly/2d3pN5b.

  • ICE BofAML U.S. High Yield Master II Index.

  • ICE BofAML U.S. Corporate Master Index.

  • CBOE Volatility Index, based on data from January 1990 through March 2018.

The chart of the week and any accompanying data is for informational purposes only and shall not be considered an investment recommendation or promotion of FS Investments or any FS Investments fund. The chart of the week is subject to change at any time based on market or other conditions, and FS Investments and FS Investment Solutions, LLC disclaim any responsibility to update such market commentary. The chart of the week should not be relied on as investment advice, and because investment decisions for the FS Investments funds are based on numerous factors, may not be relied on as an indication of the investment intent of any FS Investments fund. None of FS Investments, its funds, FS Investment Solutions, LLC or their respective affiliates can be held responsible for any direct or incidental loss incurred as a result of any reliance on the chart of the week or other opinions expressed therein. Any discussion of past performance should not be used as an indicator of future results.

This information is educational in nature and does not constitute a financial promotion, investment advice or an inducement or incitement to participate in any product, offering or investment. FS Investments is not adopting, making a recommendation for or endorsing any investment strategy or particular security. All views, opinions and positions expressed herein are that of the author and do not necessarily reflect the views, opinions or positions of FS Investments. All opinions are subject to change without notice, and you should always obtain current information and perform due diligence before participating in any investment. FS Investments does not provide legal or tax advice and the information herein should not be considered legal or tax advice. Tax laws and regulations are complex and subject to change, which can materially impact any investment result. FS Investments cannot guarantee that the information herein is accurate, complete, or timely. FS Investments makes no warranties with regard to such information or results obtained by its use, and disclaims any liability arising out of your use of, or any tax position taken in reliance on, such information.

Any projections, forecasts and estimates contained herein are based upon certain assumptions that the author considers reasonable. Projections are necessarily speculative in nature, and it can be expected that some or all of the assumptions underlying the projections will not materialize or will vary significantly from actual results. The inclusion of projections herein should not be regarded as a representation or guarantee regarding the reliability, accuracy or completeness of the information contained herein, and neither FS Investments nor the author are under any obligation to update or keep current such information.

All investing is subject to risk, including the possible loss of the money you invest.

Search our site