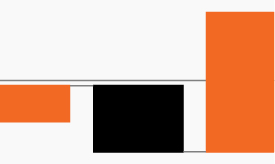
In 2018, volatility is higher and returns are lower
| Historical low-volatility year |
Following year | 2017 | 2018 YTD | ||||
| Average realized volatility |
7.2% | 11.2% | 5.3% | 18.5% | |||
| Average return |
18.2% | 0.2% | 19.4% | 2.3% |
Source: Bloomberg, Macrobond as of December 31, 2017. 2018 YTD is as of June 1, 2018. A “low-volatility year” refers to any year whose volatility falls within the lowest 10% of all years since 1928.
- 2017 was a year in which virtually everything went right for equity investors. U.S. stocks rose nearly 20% and investors experienced very little volatility along the way.1 Out of last year’s 251 trading days, for example, the S&P 500 Index experienced just eight moves of 1% or more.2
- Markets last year generally matched a pattern that has emerged throughout history in which periods of low volatility often correlate with attractive equity returns. As the table shows, markets have experienced strong annual returns (18.2%) in years when volatility has been low.
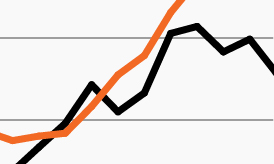
- However, markets have historically seen weak annual returns with significant spikes in volatility the year after a “low-volatility year.”3 2018 appears to be holding true to this script. Year to date, equity volatility has more than tripled from last year while returns are on pace to be far lower than in 2017.
- A range of issues could aggravate volatility in the coming months – renewed interest rate fears or a new bout of geopolitical or trade concerns, for example. Whatever the possible reason, history suggests investors may be well served by preparing their portfolios for lower returns and higher volatility within the traditional equity markets in the coming months.