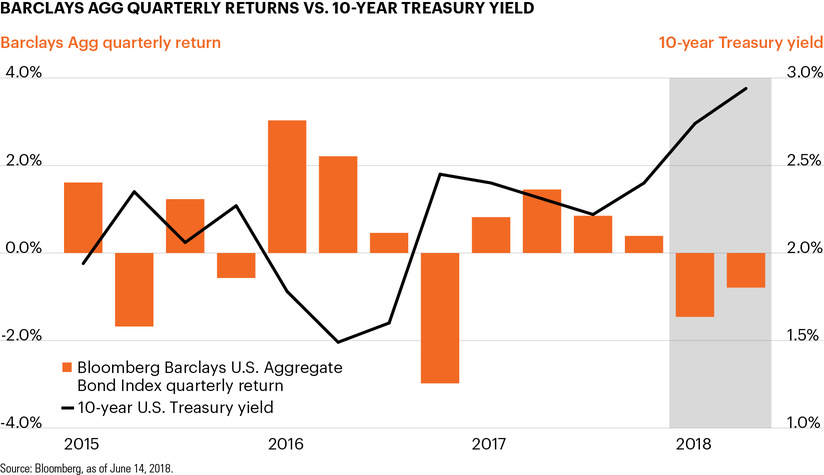
Barclays Agg quarterly returns vs. 10-year Treasury yield
June 15, 2018 | 1 minute read
The Federal Reserve’s 25 bps rate hike came as expected this week.1 Yet the FOMC raising its median estimate from three to four rate hikes this year lent a more hawkish tone to the Fed’s actions.2
Ten-year U.S. Treasury yields briefly jumped above 3% immediately following Wednesday’s rate hike.3 Yields settled later in the day, but remain toward the upper end of the 2.8%–3.1% band inside which they’ve traded for much of 2018.3
Compared to one year ago, yields on the 10-year are approximately 81 bps higher today while 2-year yields are up approximately 124 bps.3,4
While rates remain low relative to historical standards, they have been gradually rising for nearly two years. This broader environment has tempered returns on traditional fixed income investments in both recent quarters and recent years.
The Bloomberg Barclays U.S. Aggregate Bond Index, a benchmark that measures the performance across the traditional fixed income investment landscape, has produced an average return of just 0.3% in the nearly three and a half years since January 2015. Year to date, the index has returned -2.1%.5
We’ve noted in the past that many analysts don’t expect investment returns in the coming decade to be as strong as those of the past 10 years. Within this environment, it could become increasingly important for investors to find alternative sources of return and portfolio diversification outside the scope of traditional investments.
This week’s chart looks at return drivers for middle market buyout transactions, which have generated higher realized capital multiples than large cap and may favor middle market managers looking forward.