Chart of the week

Volatile start to Q4 as interest rates jump

See how the recent, rapid sell-off in stock and bond markets has impacted fixed income assets.

October 12, 2018 | 1 minute read
Performance across major fixed income asset classes
  • After reaching a 7-year high last week, interest rates remained elevated this week.1 The 10-year U.S. Treasury yield climbed above 3.25% on Tuesday before moving slightly lower later in the week.1 The 10-year yield has climbed as high as 80 bps YTD, and as much as 16 bps of this rise came in the past 11 days.1
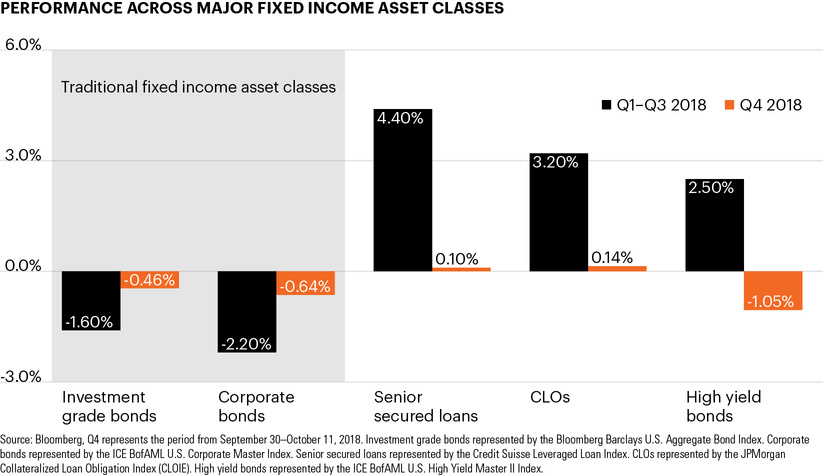
  • The 10-year’s sudden rise has helped spur a rapid sell-off across many stock and bond asset classes. As the chart shows, traditional fixed income investments have seen substantial declines this year. In just the first two weeks of October, investment grade and corporate bonds are on their way toward matching their declines of the first three quarters of 2018.2
  • The decline is largely due to investment grade bonds’ sensitivity to changes in interest rates, which is significantly higher than a decade ago.3
  • In contrast, senior secured loans and CLOs, which consist of a pool of underlying loans, feature significantly less interest rate risk than traditional bonds and have maintained modestly positive returns in October.3
  • Amid rising rates, investing in a broad range of fixed income asset classes with varying levels of interest rate risk may help buoy a portfolio’s returns while also providing a competitive level of income.

  • Federal Reserve Bank of St. Louis, https://bit.ly/29ecBfp.

  • Bloomberg, Q4 represents the period from September 30–October 11. Investment grade bonds represented by the Bloomberg Barclays U.S. Aggregate Bond Index. Corporate bonds represented by the ICE BofAML U.S. Corporate Master Index. Senior secured loans represented by the Credit Suisse Leveraged Loan Index. CLOs represented by the JPMorgan CLOIE. High yield bonds represented by the ICE BofAML U.S. High Yield Master II Index.

  • Bloomberg, based on the duration of the Bloomberg Barclays U.S. Aggregate Bond Index, as of October 11, 2018.

The chart of the week and any accompanying data is for informational purposes only and shall not be considered an investment recommendation or promotion of FS Investments or any FS Investments fund. The chart of the week is subject to change at any time based on market or other conditions, and FS Investments and FS Investment Solutions, LLC disclaim any responsibility to update such market commentary. The chart of the week should not be relied on as investment advice, and because investment decisions for the FS Investments funds are based on numerous factors, may not be relied on as an indication of the investment intent of any FS Investments fund. None of FS Investments, its funds, FS Investment Solutions, LLC or their respective affiliates can be held responsible for any direct or incidental loss incurred as a result of any reliance on the chart of the week or other opinions expressed therein. Any discussion of past performance should not be used as an indicator of future results.

This information is educational in nature and does not constitute a financial promotion, investment advice or an inducement or incitement to participate in any product, offering or investment. FS Investments is not adopting, making a recommendation for or endorsing any investment strategy or particular security. All views, opinions and positions expressed herein are that of the author and do not necessarily reflect the views, opinions or positions of FS Investments. All opinions are subject to change without notice, and you should always obtain current information and perform due diligence before participating in any investment. FS Investments does not provide legal or tax advice and the information herein should not be considered legal or tax advice. Tax laws and regulations are complex and subject to change, which can materially impact any investment result. FS Investments cannot guarantee that the information herein is accurate, complete, or timely. FS Investments makes no warranties with regard to such information or results obtained by its use, and disclaims any liability arising out of your use of, or any tax position taken in reliance on, such information.

Any projections, forecasts and estimates contained herein are based upon certain assumptions that the author considers reasonable. Projections are necessarily speculative in nature, and it can be expected that some or all of the assumptions underlying the projections will not materialize or will vary significantly from actual results. The inclusion of projections herein should not be regarded as a representation or guarantee regarding the reliability, accuracy or completeness of the information contained herein, and neither FS Investments nor the author are under any obligation to update or keep current such information.

All investing is subject to risk, including the possible loss of the money you invest.

Search our site