Chart of the week

Active fixed income managers are adjusting for rising rates

See why a passive management strategy and rising rates may not mix when it comes to fixed income assets.

November 2, 2018 | 1 minute read
Diverging durations between active and passively managed strategies
  • Traditional fixed income asset classes have been challenged in 2018 as interest rates have seen their first sustained rise in more than a decade. The Bloomberg Barclays U.S. Aggregate Bond Index (Barclays Agg), a proxy for traditional core fixed income investments, has returned approximately -2.4% YTD as the 10-year U.S. Treasury yield has risen more than 70 bps since January.1
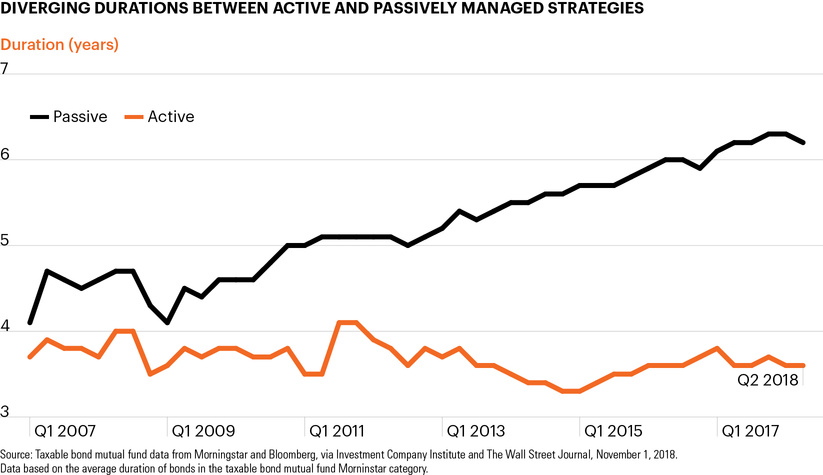
  • One reason the Barclays Agg has underperformed this year lies in the fact that its sensitivity to interest rate changes, or duration, has gradually increased over the past decade, from 3.7 years in 2009 to 5.9 years today.1
  • As the chart shows, we have seen a similar increase across passive fixed income strategies since 2007.2 In fact, the duration gap between active and passive fixed income strategies is wider today than it has been at any time since 2007.2
  • Active managers have been preparing for interest rates to rise for some time, gradually reducing their durations by investing in shorter-term bonds that are less sensitive to rising rates. Meanwhile, the duration profile on passive strategies has risen alongside the underlying assets they track.
  • Investors have seen volatility spike in October across both the equity and fixed income markets. Within this environment, now may be a good time for investors to consider actively managing the risks within their portfolios.

  • Bloomberg, as of November 1, 2018.

  • Taxable bond mutual fund data from Morningstar and Bloomberg, via Investment Company Institute and The Wall Street Journal, November 1, 2018, https://on.wsj.com/2RreKHl.

The chart of the week and any accompanying data is for informational purposes only and shall not be considered an investment recommendation or promotion of FS Investments or any FS Investments fund. The chart of the week is subject to change at any time based on market or other conditions, and FS Investments and FS Investment Solutions, LLC disclaim any responsibility to update such market commentary. The chart of the week should not be relied on as investment advice, and because investment decisions for the FS Investments funds are based on numerous factors, may not be relied on as an indication of the investment intent of any FS Investments fund. None of FS Investments, its funds, FS Investment Solutions, LLC or their respective affiliates can be held responsible for any direct or incidental loss incurred as a result of any reliance on the chart of the week or other opinions expressed therein. Any discussion of past performance should not be used as an indicator of future results.

This information is educational in nature and does not constitute a financial promotion, investment advice or an inducement or incitement to participate in any product, offering or investment. FS Investments is not adopting, making a recommendation for or endorsing any investment strategy or particular security. All views, opinions and positions expressed herein are that of the author and do not necessarily reflect the views, opinions or positions of FS Investments. All opinions are subject to change without notice, and you should always obtain current information and perform due diligence before participating in any investment. FS Investments does not provide legal or tax advice and the information herein should not be considered legal or tax advice. Tax laws and regulations are complex and subject to change, which can materially impact any investment result. FS Investments cannot guarantee that the information herein is accurate, complete, or timely. FS Investments makes no warranties with regard to such information or results obtained by its use, and disclaims any liability arising out of your use of, or any tax position taken in reliance on, such information.

Any projections, forecasts and estimates contained herein are based upon certain assumptions that the author considers reasonable. Projections are necessarily speculative in nature, and it can be expected that some or all of the assumptions underlying the projections will not materialize or will vary significantly from actual results. The inclusion of projections herein should not be regarded as a representation or guarantee regarding the reliability, accuracy or completeness of the information contained herein, and neither FS Investments nor the author are under any obligation to update or keep current such information.

All investing is subject to risk, including the possible loss of the money you invest.

Search our site