Chart of the week

High yield bonds shine amid Fed pause

Get insight into why high yield bonds may be an attractive diversification tool in our lower-for-longer interest rate environment.

March 22, 2019 | 2 minute read
Fixed income price returns
  • At their meeting this week, Fed policymakers held the target federal funds rate steady once again and reasserted the dovish stance that largely ignited the market rally in late December.1
  • Prices on U.S. Treasuries jumped immediately after the meeting as the yield on the 10-year U.S. Treasury note dropped to just 2.52%.2 With the Fed firmly on the sidelines for now, the 10-year yield has seen an approximately 70 bps decline in the past four months and reached its lowest level since January 2018.2
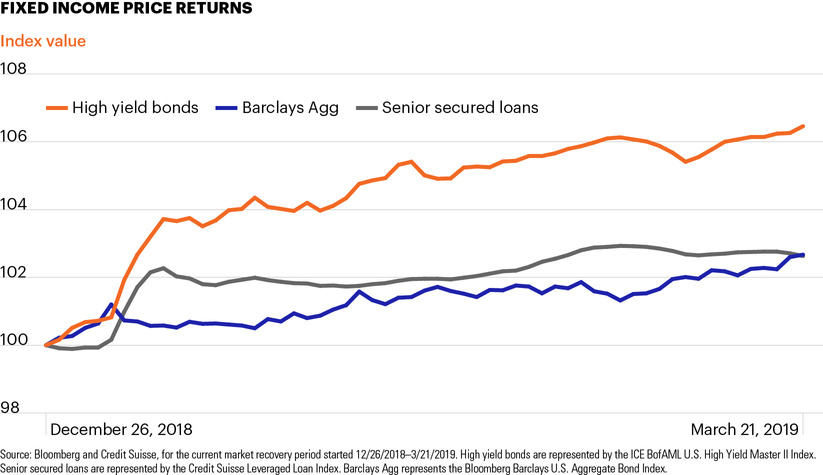
  • Since equity markets began their rise on December 26, 2018, fixed income asset classes also have risen, with a notable divergence emerging. In that time frame, high yield bonds have returned approximately 7.7% versus 4.1% for senior secured loans and 2.3% for the Bloomberg Barclays U.S. Aggregate Bond Index, a proxy for traditional core fixed income investments.3
  • High yield bond funds have seen significant YTD inflows versus the historic outflows they experienced in Q4 2018.4 Amid diminished rate concerns, bank loan mutual funds have seen YTD outflows, though they remain under Q4 2018 levels.4
  • Investor interest in high yield bonds has increased this year as the Fed’s shift has further compressed yields across traditional fixed income asset classes and as the U.S. economy continues to experience slow-but-positive growth with minimal inflation pressures.
  • While the performance of each fixed income class can vary across the phases of a market cycle, the Fed’s recent lower-for-longer emphasis may encourage investors to continue looking beyond traditional core fixed income allocations and diversify their holdings within fixed income, including high yield bonds.

  • U.S. Federal Reserve, https://bit.ly/2Csirr8.

  • Federal Reserve Bank of St. Louis, https://bit.ly/29ecBfp.

  • High yield bonds are represented by the ICE BofAML U.S. High Yield Master II Index. Senior secured loans are represented by the Credit Suisse Leveraged Loan Index.

  • Thomson Reuters Lipper, as of March 22, 2019.

The chart of the week and any accompanying data is for informational purposes only and shall not be considered an investment recommendation or promotion of FS Investments or any FS Investments fund. The chart of the week is subject to change at any time based on market or other conditions, and FS Investments and FS Investment Solutions, LLC disclaim any responsibility to update such market commentary. The chart of the week should not be relied on as investment advice, and because investment decisions for the FS Investments funds are based on numerous factors, may not be relied on as an indication of the investment intent of any FS Investments fund. None of FS Investments, its funds, FS Investment Solutions, LLC or their respective affiliates can be held responsible for any direct or incidental loss incurred as a result of any reliance on the chart of the week or other opinions expressed therein. Any discussion of past performance should not be used as an indicator of future results.

This information is educational in nature and does not constitute a financial promotion, investment advice or an inducement or incitement to participate in any product, offering or investment. FS Investments is not adopting, making a recommendation for or endorsing any investment strategy or particular security. All views, opinions and positions expressed herein are that of the author and do not necessarily reflect the views, opinions or positions of FS Investments. All opinions are subject to change without notice, and you should always obtain current information and perform due diligence before participating in any investment. FS Investments does not provide legal or tax advice and the information herein should not be considered legal or tax advice. Tax laws and regulations are complex and subject to change, which can materially impact any investment result. FS Investments cannot guarantee that the information herein is accurate, complete, or timely. FS Investments makes no warranties with regard to such information or results obtained by its use, and disclaims any liability arising out of your use of, or any tax position taken in reliance on, such information.

Any projections, forecasts and estimates contained herein are based upon certain assumptions that the author considers reasonable. Projections are necessarily speculative in nature, and it can be expected that some or all of the assumptions underlying the projections will not materialize or will vary significantly from actual results. The inclusion of projections herein should not be regarded as a representation or guarantee regarding the reliability, accuracy or completeness of the information contained herein, and neither FS Investments nor the author are under any obligation to update or keep current such information.

All investing is subject to risk, including the possible loss of the money you invest.

Search our site