Chart of the week

Low rates, solid fundamentals continue to support commercial real estate

How healthy is the commercial real estate debt market? This week’s chart looks at why it may be an attractive opportunity for investors seeking income in 2020.

January 17, 2020 | 1 minute read
  • The commercial real estate (CRE) market heads into the new year looking like a mirror image of the broader economy – still healthy but moderating, with wider dispersion between sectors becoming apparent.
  • CRE property prices continue to grow at a solid clip, with price growth having accelerated somewhat during Q4 2019. While there is unlikely to be an extended bounce in price growth, it is a welcome sign that property demand remains steady despite a growing performance spread between sectors, with industrial leading the way and retail lagging.
  • Meanwhile, metrics on the debt side of the ledger paint a picture of a market that is functioning exceptionally well but not overheated. Lower interest rates have helped keep debt financing attractive, and banks reported improving demand for CRE loans late last year.
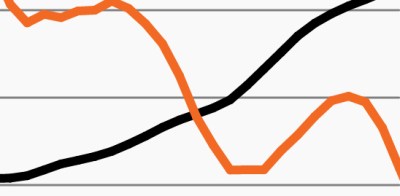
  • Loan-to-value (LTV) ratios continue to be relatively conservative (currently 62%) and slightly below the long-term average of 64%.1 As the chart highlights, debt-service coverage also remains a bright spot at nearly 2.0x, comfortably above its level one year ago.1
  • With credit market yields hovering near multi-year lows and equity markets at new all-time highs, the U.S. CRE debt market, backed by a solid fundamental picture, may present an attractive opportunity for investors seeking steady income and growth potential in the new year.

  • Real Capital Analytics, as of October 2019 (latest data available).

The chart of the week and any accompanying data is for informational purposes only and shall not be considered an investment recommendation or promotion of FS Investments or any FS Investments fund. The chart of the week is subject to change at any time based on market or other conditions, and FS Investments and FS Investment Solutions, LLC disclaim any responsibility to update such market commentary. The chart of the week should not be relied on as investment advice, and because investment decisions for the FS Investments funds are based on numerous factors, may not be relied on as an indication of the investment intent of any FS Investments fund. None of FS Investments, its funds, FS Investment Solutions, LLC or their respective affiliates can be held responsible for any direct or incidental loss incurred as a result of any reliance on the chart of the week or other opinions expressed therein. Any discussion of past performance should not be used as an indicator of future results.

This information is educational in nature and does not constitute a financial promotion, investment advice or an inducement or incitement to participate in any product, offering or investment. FS Investments is not adopting, making a recommendation for or endorsing any investment strategy or particular security. All views, opinions and positions expressed herein are that of the author and do not necessarily reflect the views, opinions or positions of FS Investments. All opinions are subject to change without notice, and you should always obtain current information and perform due diligence before participating in any investment. FS Investments does not provide legal or tax advice and the information herein should not be considered legal or tax advice. Tax laws and regulations are complex and subject to change, which can materially impact any investment result. FS Investments cannot guarantee that the information herein is accurate, complete, or timely. FS Investments makes no warranties with regard to such information or results obtained by its use, and disclaims any liability arising out of your use of, or any tax position taken in reliance on, such information.

Any projections, forecasts and estimates contained herein are based upon certain assumptions that the author considers reasonable. Projections are necessarily speculative in nature, and it can be expected that some or all of the assumptions underlying the projections will not materialize or will vary significantly from actual results. The inclusion of projections herein should not be regarded as a representation or guarantee regarding the reliability, accuracy or completeness of the information contained herein, and neither FS Investments nor the author are under any obligation to update or keep current such information.

All investing is subject to risk, including the possible loss of the money you invest.

Search our site