Chart of the week

Diverging durations leave corporate bond investors increasingly exposed

Are your investments more vulnerable to price loss if interest rates move higher? This week’s chart shows how durations have diverged on investment grade and high yield bonds.

January 25, 2020 | 1 minute read
  • Corporations have taken advantage of the ultra-low interest rate environment of the past decade, with many investment grade companies refinancing or issuing new, longer-dated bonds. Just since November 2018, for example, the average time to maturity on investment grade corporate debt rose by nearly a full year (from 10.6 to 11.5 years).1
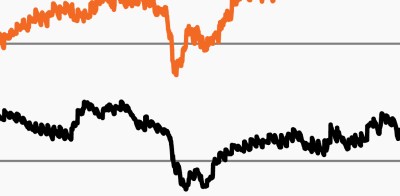
  • Against this backdrop, the duration on the Bloomberg Barclays U.S. Corporate Bond Index, which measures investment grade bonds’ sensitivity to changes in interest rates, moved gradually higher through much of the past two decades and spiked in 2019.1
  • As the chart shows, the duration on high yield bonds has largely been a mirror image to that of investment grade debt, slowly declining the past 20 years and plummeting last year.1
  • In other words, traditional investment grade bonds – which many investors rely on as a source of income, stability and capital preservation – have become increasingly exposed to interest rate risk. High yield bonds, also a source of income for many investors, face less interest rate risk today than they did one year ago and far less than investment grade bonds.
  • Since the level of income traditional bonds provide has declined the past several decades, rising durations may leave investors increasingly vulnerable to price losses if rates move higher. While high yield bonds are subject to greater credit risk, they continue to be supported by an improving global economic outlook coupled with stable fundamentals, including low default rates and ample cash flows that allow high yield issuers to continue paying their debt service costs comfortably.

  • Bloomberg Finance, L.P., as of January 22, 2020.

The chart of the week and any accompanying data is for informational purposes only and shall not be considered an investment recommendation or promotion of FS Investments or any FS Investments fund. The chart of the week is subject to change at any time based on market or other conditions, and FS Investments and FS Investment Solutions, LLC disclaim any responsibility to update such market commentary. The chart of the week should not be relied on as investment advice, and because investment decisions for the FS Investments funds are based on numerous factors, may not be relied on as an indication of the investment intent of any FS Investments fund. None of FS Investments, its funds, FS Investment Solutions, LLC or their respective affiliates can be held responsible for any direct or incidental loss incurred as a result of any reliance on the chart of the week or other opinions expressed therein. Any discussion of past performance should not be used as an indicator of future results.

This information is educational in nature and does not constitute a financial promotion, investment advice or an inducement or incitement to participate in any product, offering or investment. FS Investments is not adopting, making a recommendation for or endorsing any investment strategy or particular security. All views, opinions and positions expressed herein are that of the author and do not necessarily reflect the views, opinions or positions of FS Investments. All opinions are subject to change without notice, and you should always obtain current information and perform due diligence before participating in any investment. FS Investments does not provide legal or tax advice and the information herein should not be considered legal or tax advice. Tax laws and regulations are complex and subject to change, which can materially impact any investment result. FS Investments cannot guarantee that the information herein is accurate, complete, or timely. FS Investments makes no warranties with regard to such information or results obtained by its use, and disclaims any liability arising out of your use of, or any tax position taken in reliance on, such information.

Any projections, forecasts and estimates contained herein are based upon certain assumptions that the author considers reasonable. Projections are necessarily speculative in nature, and it can be expected that some or all of the assumptions underlying the projections will not materialize or will vary significantly from actual results. The inclusion of projections herein should not be regarded as a representation or guarantee regarding the reliability, accuracy or completeness of the information contained herein, and neither FS Investments nor the author are under any obligation to update or keep current such information.

All investing is subject to risk, including the possible loss of the money you invest.

Search our site