Chart of the week

Volatility has remained contained, but global risks rise

How long will lower volatility last? Our chart looks at daily price moves and current risks that could create a bumpier ride for investors.

February 21, 2020 | 2 minute read
S&P 500 index daily price moves
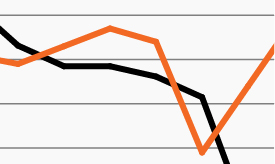
  • The U.S. equity market has been remarkably resilient since the volatility of Q4 2018. Stocks benefited recently from a host of better-than-expected economic releases, including strong consumer sentiment and jobs data, improving manufacturing numbers and a spike in housing starts since January.
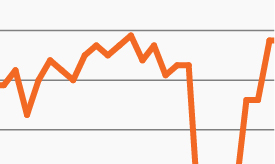
  • The stock market’s rise over the past several months also has come with minimal daily volatility, as the chart shows. Since mid-October 2019, the S&P 500 has risen approximately 11%, but experienced only five daily moves greater than 1%.1 (The five days that did see 1%-plus daily moves were clustered in a brief late January-early February swoon.)
  • Despite the recent upbeat economic news, however, investors may be shrugging off a host of potential threats that could drive volatility higher once again. Several current risks include high and rising equity valuations, souring earnings projections, decelerating economic growth in Germany and Japan and the still-to-be-determined economic impact of COVID-19.2
  • The Treasury market appears to be accounting for these risks while the equity markets may not be. The 10-year Treasury yield has fallen approximately 45 bps in 2020, for example, while the 2Y-10Y yield curve has flattened significantly.
  • Despite the range of potential warning signs, the U.S. equity market could of course continue its torrid pace for the foreseeable future. With markets still riding high, however, now may also be a good time for prudent investors to consider preparing their portfolios for a potential pullback.

  • Bloomberg Finance, L.P. Data refers to an extended period of minimal daily volatility (October 14, 2019–February 20, 2020).

  • Federal Reserve, http://bit.ly/38LKqjQ.

The chart of the week and any accompanying data is for informational purposes only and shall not be considered an investment recommendation or promotion of FS Investments or any FS Investments fund. The chart of the week is subject to change at any time based on market or other conditions, and FS Investments and FS Investment Solutions, LLC disclaim any responsibility to update such market commentary. The chart of the week should not be relied on as investment advice, and because investment decisions for the FS Investments funds are based on numerous factors, may not be relied on as an indication of the investment intent of any FS Investments fund. None of FS Investments, its funds, FS Investment Solutions, LLC or their respective affiliates can be held responsible for any direct or incidental loss incurred as a result of any reliance on the chart of the week or other opinions expressed therein. Any discussion of past performance should not be used as an indicator of future results.

This information is educational in nature and does not constitute a financial promotion, investment advice or an inducement or incitement to participate in any product, offering or investment. FS Investments is not adopting, making a recommendation for or endorsing any investment strategy or particular security. All views, opinions and positions expressed herein are that of the author and do not necessarily reflect the views, opinions or positions of FS Investments. All opinions are subject to change without notice, and you should always obtain current information and perform due diligence before participating in any investment. FS Investments does not provide legal or tax advice and the information herein should not be considered legal or tax advice. Tax laws and regulations are complex and subject to change, which can materially impact any investment result. FS Investments cannot guarantee that the information herein is accurate, complete, or timely. FS Investments makes no warranties with regard to such information or results obtained by its use, and disclaims any liability arising out of your use of, or any tax position taken in reliance on, such information.

Any projections, forecasts and estimates contained herein are based upon certain assumptions that the author considers reasonable. Projections are necessarily speculative in nature, and it can be expected that some or all of the assumptions underlying the projections will not materialize or will vary significantly from actual results. The inclusion of projections herein should not be regarded as a representation or guarantee regarding the reliability, accuracy or completeness of the information contained herein, and neither FS Investments nor the author are under any obligation to update or keep current such information.

All investing is subject to risk, including the possible loss of the money you invest.

Search our site