Chart of the week

Near-zero interest rates intensify the hunt for yield

From low yield to no yield? This week’s chart illustrates the dire state of the search for income via government bonds.

May 8, 2020 | 1 minute read
  • Fed purchases have helped to quell volatility across the fixed income market as the COVID-19 health crisis began to spread throughout the U.S. The MOVE Index, which measures expected rate volatility within the Treasury market, has fallen from a peak of 164 to approximately 54 today.1    
  • Though credit market volatility may be more settled now, investors’ search for income has become more challenged than ever as rates have transitioned from a low-yield environment to an almost no-yield one.
  • The Barclays Agg is delivering approximately just 1.3% of income while the 10-year U.S. Treasury yields a paltry 0.69%, only slightly above its historic low of 0.57% on March 9.1
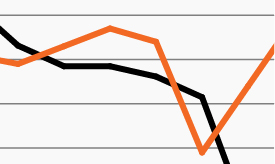
  • As low as the 10-year yield is today, it actually offers a slight yield premium versus other major government bonds, as the chart highlights. U.K. 10-year government bonds yield just 0.25% while German 10-year government bonds feature negative yields.2 
  • Today’s global rate environment highlights the fact that investors’ search for competitive income will likely remain more important than ever in the coming years. Importantly, it also contrasts sharply with equity investors’ recent optimism that the U.S. will experience a relatively rapid economic recovery as states begin to reopen their economies.

  • As of May 7, 2020. MOVE Index refers to the ICE BofAML U.S. Bond Market Option Volatility Estimate Index. Barclays Agg refers to the Bloomberg Barclays U.S. Aggregate Bond Index.

  • Federal Reserve Bank of St. Louis, as of May 7, 2020.

The chart of the week and any accompanying data is for informational purposes only and shall not be considered an investment recommendation or promotion of FS Investments or any FS Investments fund. The chart of the week is subject to change at any time based on market or other conditions, and FS Investments and FS Investment Solutions, LLC disclaim any responsibility to update such market commentary. The chart of the week should not be relied on as investment advice, and because investment decisions for the FS Investments funds are based on numerous factors, may not be relied on as an indication of the investment intent of any FS Investments fund. None of FS Investments, its funds, FS Investment Solutions, LLC or their respective affiliates can be held responsible for any direct or incidental loss incurred as a result of any reliance on the chart of the week or other opinions expressed therein. Any discussion of past performance should not be used as an indicator of future results.

This information is educational in nature and does not constitute a financial promotion, investment advice or an inducement or incitement to participate in any product, offering or investment. FS Investments is not adopting, making a recommendation for or endorsing any investment strategy or particular security. All views, opinions and positions expressed herein are that of the author and do not necessarily reflect the views, opinions or positions of FS Investments. All opinions are subject to change without notice, and you should always obtain current information and perform due diligence before participating in any investment. FS Investments does not provide legal or tax advice and the information herein should not be considered legal or tax advice. Tax laws and regulations are complex and subject to change, which can materially impact any investment result. FS Investments cannot guarantee that the information herein is accurate, complete, or timely. FS Investments makes no warranties with regard to such information or results obtained by its use, and disclaims any liability arising out of your use of, or any tax position taken in reliance on, such information.

Any projections, forecasts and estimates contained herein are based upon certain assumptions that the author considers reasonable. Projections are necessarily speculative in nature, and it can be expected that some or all of the assumptions underlying the projections will not materialize or will vary significantly from actual results. The inclusion of projections herein should not be regarded as a representation or guarantee regarding the reliability, accuracy or completeness of the information contained herein, and neither FS Investments nor the author are under any obligation to update or keep current such information.

All investing is subject to risk, including the possible loss of the money you invest.

Search our site