Chart of the week

Spike in HY issuance stresses the importance of active management

Sales surging after near collapse? Our chart looks at how the massive spike in new high yield issues displays the importance of active management.

June 26, 2020 | 2 minute read
  • Since bottoming in late February, the high yield bond market has recovered almost as quickly as it declined. The asset class has benefited from unprecedented monetary and fiscal stimulus along with optimism surrounding a reopening U.S. economy.
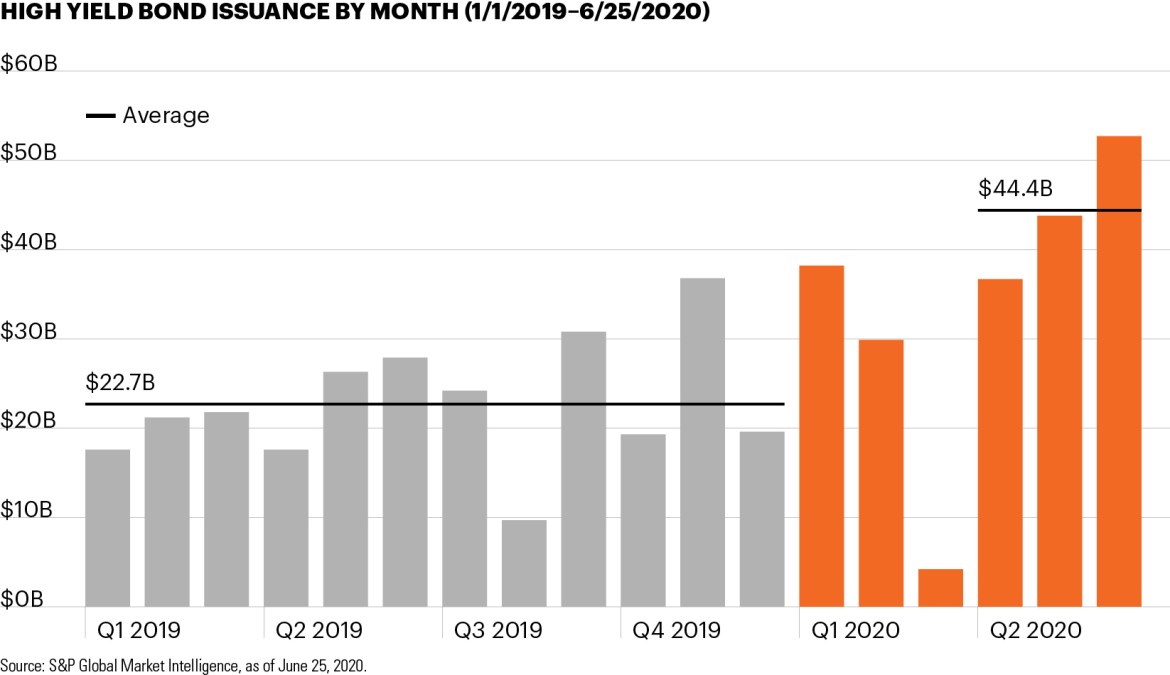
  • To this end, new high yield bond issuance declined in February and nearly collapsed in March before recovering rapidly – it is now up 40% year over year.1 As the chart highlights, the monthly average of new issuance during the past three months is almost double that of 2019 as corporations (across the investment grade and high yield universes) have raced to issue debt at a faster pace than at any time in well over a decade.1
  • While massive new issuance has outpaced even record inflows, the Fed’s willingness to intervene directly in corporate bond markets and act as a backstop source of demand has drastically improved sentiment, ultimately lending a constructive outlook for the asset class.
  • Quarter to date, high yield bonds have returned approximately 10.7%. They are now down just -3.8% YTD and may have room for additional upside.2 Spreads on high yield bonds have declined significantly from their peak but have historically been lower than they are today about 75% of the time.2 In other words, they may have room to fall further. (A bond’s price rises when its spread, or yield above the risk-free rate, declines.)
  • Despite the broadly supportive picture, many risks remain. Credit fundamentals have weakened amid the pandemic and default rates have risen, leading some market forecasters to think default rates could double by the end of 2020. Against this backdrop, experienced, active management may be more important than ever in discerning which businesses have the strongest balance sheets and operating models or may have been unfairly punished in the broader market sell-off.

  • S&P Global Market Intelligence, as of June 25, 2020.

  • ICE BofAML U.S. High Yield Master II Index, as of June 25, 2020.

The chart of the week and any accompanying data is for informational purposes only and shall not be considered an investment recommendation or promotion of FS Investments or any FS Investments fund. The chart of the week is subject to change at any time based on market or other conditions, and FS Investments and FS Investment Solutions, LLC disclaim any responsibility to update such market commentary. The chart of the week should not be relied on as investment advice, and because investment decisions for the FS Investments funds are based on numerous factors, may not be relied on as an indication of the investment intent of any FS Investments fund. None of FS Investments, its funds, FS Investment Solutions, LLC or their respective affiliates can be held responsible for any direct or incidental loss incurred as a result of any reliance on the chart of the week or other opinions expressed therein. Any discussion of past performance should not be used as an indicator of future results.

This information is educational in nature and does not constitute a financial promotion, investment advice or an inducement or incitement to participate in any product, offering or investment. FS Investments is not adopting, making a recommendation for or endorsing any investment strategy or particular security. All views, opinions and positions expressed herein are that of the author and do not necessarily reflect the views, opinions or positions of FS Investments. All opinions are subject to change without notice, and you should always obtain current information and perform due diligence before participating in any investment. FS Investments does not provide legal or tax advice and the information herein should not be considered legal or tax advice. Tax laws and regulations are complex and subject to change, which can materially impact any investment result. FS Investments cannot guarantee that the information herein is accurate, complete, or timely. FS Investments makes no warranties with regard to such information or results obtained by its use, and disclaims any liability arising out of your use of, or any tax position taken in reliance on, such information.

Any projections, forecasts and estimates contained herein are based upon certain assumptions that the author considers reasonable. Projections are necessarily speculative in nature, and it can be expected that some or all of the assumptions underlying the projections will not materialize or will vary significantly from actual results. The inclusion of projections herein should not be regarded as a representation or guarantee regarding the reliability, accuracy or completeness of the information contained herein, and neither FS Investments nor the author are under any obligation to update or keep current such information.

All investing is subject to risk, including the possible loss of the money you invest.

Search our site